Connect with us
...

Finance

August once again lives up to its dismal

Published

on

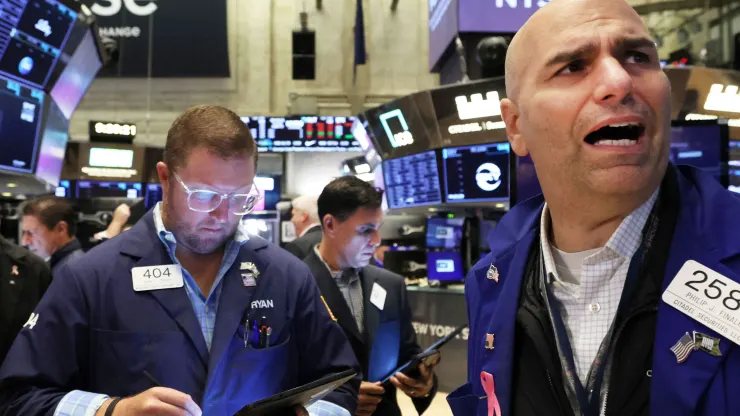
Wall Street is really suffering through the dog days of August.

The S&P 500 is down more than 3% this month, on pace to snap a five-month winning streak. The broader market index is also on track to post its worst monthly performance since December, when it lost 5.9%.

The Nasdaq Composite is also headed for its biggest one-month loss since December, falling 5.2%. The Dow Jones Industrial Average has declined 3% in August.

These pullbacks are a contrast to the market rally seen earlier this year. The Nasdaq Composite had its best first-half performance in 40 years in 2023. The S&P 500′s gains over the first six months of the year marked the index’s best start to a year since 2021.

There are several things pressuring Wall Street now, ranging from seasonal factors to concerns about the global economy and the Federal Reserve. Here’s a breakdown.

Tough month for the S&P 500

August — historically a tough month

This behavior at this time of the year isn’t out of character.

Over the past 10 years, the S&P 500 has averaged a gain of just 0.1% for August — making it the third-worst month for the index, CNBC Pro analysis of seasonal trends showed. Go back 20 years and the performance gets worse: The S&P 500 has averaged a monthly 0.1% loss in that time.

There are several reasons the market tends to see lackluster performances this month, including:

  • Lower trading volumes: Trading tends to decline in August as traders and investors go on vacation before the summer ends. This can lead to more volatile swings in prices.
  • Booking profits before September: While August is a tough month for Wall Street, it has nothing on September — historically the worst of all months for the market. The S&P 500 has averaged a 0.5% loss in September over the past 20 years. Over the past 10 years, the S&P 500 has fallen an average of 1% each September.

“The S&P 500 continues to track its seasonal tendency,” Oppenheimer technical strategist Ari Wald wrote earlier this month. “For S&P 500 levels, we see 4,400 as the start of support (50-day average) that extends down to 4,200 (Feb. peak).”

China’s struggles

Economic data out of China has been lackluster, to say the least. The world’s second-largest economy earlier this month reported much weaker-than-expected retail sales growth for July, while industrial production also rose less than expected.

A slowdown in China’s economy could spell trouble for markets around the world, including the U.S., given the sheer number of major corporations that rely on the country as a strong source of revenue.

Additionally, concerns over another real estate crisis in China are developing. Heavily indebted Country Garden Holdings fell to a record low and was removed from the Hang Seng stock index in Hong Kong. Evergrande, another Chinese real estate giant, filed for bankruptcy protection in the U.S. last week. All this led the Chinese central bank to cut interest rates this month.

“The country needs a good U.S.-style restructuring of its real estate market, where apartment prices are slashed, debt is restructured, and new equity investors are brought in as grave-dancers,” Ed Yardeni of Yardeni Research said in a note earlier in August. “Until then, we’re left watching the wreckage unfold.”

Higher Treasury yields

Another source of market pressure this month has been concern that the Fed will keep its benchmark lending rates higher for longer than anticipated. Earlier this week, that drove the 10-year Treasury note yield to its highest level since 2007.

In a summary from its July meeting, the Fed noted that central bank officials still see “upside risks” to inflation — which could lead to more rate hikes. Specifically, the central bank said: “With inflation still well above the Committee’s longer-run goal and the labor market remaining tight, most participants continued to see significant upside risks to inflation, which could require further tightening of monetary policy.”

This all comes as new data appears to show inflation is moving closer to the Fed’s 2% target. The consumer price index, a widely followed inflation gauge, rose 3.2% in July on a year-over-year basis. That rate is well below last year’s pace, when CPI peaked at 9.1%, the highest in 40 years.

Investors will get more clues on the potential for future Fed tightening on Friday, when Chair Jerome Powell delivers a speech at an annual economic symposium in Jackson Hole, Wyoming.

— Reports /TrainViral/

Continue Reading
Click to comment

Leave a Reply

Your email address will not be published. Required fields are marked *

Crypto

Bitcoin’s Recovery – the Downturn Is Over

Published

on

By

The market is currently in a news-driven environment where the prices of cryptocurrencies have been determined by news agenda rather than fundamentals.

Bitfinex analysts have warned crypto investors to be cautious as bitcoin’s (BTC) recovery over the weekend is not a sign that its correction is over; the asset could witness more bloodshed in the near term.

In the latest Bitfinex Alpha report, experts deemed the market’s reaction this week critical, especially as supply alleviated over the weekend could return when traditional markets open.

“No Man’s Land”

Since Saturday, bitcoin has risen almost 10% from $57,600 to $63,000, closing last week in the green. The asset has surged above the 125-day range low of $60,200, which it broke through earlier this month after news of the German government’s massive BTC selling hit the market.

Market sentiment began to improve after reports that wallets linked to the German government were almost empty. However, the positive sentiment may not be sustained for long as the BTC the German authorities moved to trading desks and exchanges are yet to be sold.

While the supply from Germany appears to have been factored into bitcoin’s market price, Bitfinex analysts believe the end of selling pressure depends on how the involved trading desks execute their trades in the coming days.

Although the shift in sentiment underscores the market’s capacity to integrate new information and adjust expectations quickly, analysts think the market’s reaction over the first two trading days of the week cannot be overlooked for two reasons.

First, the low support level in the $60,200 range has now become a potential resistance line. Second, trading patterns over the past three months suggest that weekends are usually favorable for markets, especially on Saturdays when supply pressure seems to subside.

“We are now in no man’s land until we get clear resolution above or below this level,” the analysts said.

A News-Driven Environment

Besides the potential resistance level and three-month weekend trading pattern, the market is currently in a news-driven environment, where the prices of cryptocurrencies have been determined by news agendas rather than fundamentals.

Since selling pressure concerns are not yet completely obsolete due to upcoming Mt Gox creditor distributions, Bitfinex analysts expect such headlines to continue to have some impact on price movements. As such, the analysts urged investors to exercise caution in their trading strategies.

Reports /Trainviral/

Continue Reading

Crypto

Bitcoin ETFs Saw $300M in Daily Net Inflows

Published

on

By

BlackRock’s IBIT led with $117.25 million in inflows on July 15, also being the most traded Bitcoin ETF.

The US spot Bitcoin ETFs recorded a daily net inflow of $301 million on July 15th. This extended their winning streak to seven consecutive days amidst a broader market recovery.

None of the ETFs recorded outflows for the day.

Bitcoin ETFs Rake in $16.11B in Net Inflows Since Jan

According to the data compiled by SoSoValue, BlackRock’s IBIT, the top spot Bitcoin ETF by net asset value, recorded the largest net inflows of the day at $117.25 million. IBIT was also the most actively traded Bitcoin ETF on Monday, with a volume of $1.24 billion. Ark Invest and 21Shares’ ARKB came in close behind with net inflows of $117.19 million.

Fidelity’s FBTC experienced net inflows of $36.15 million on Monday, while Bitwise’s BITB saw $15.24 million in inflows. VanEck’s HODL, Invesco and Galaxy Digital’s BTCO, and Franklin Templeton’s EZBC funds also recorded net inflows. Meanwhile, Grayscale’s GBTC and other ETFs, such as Valkyrie’s BRRR, WisdomTree’s BTCW, and Hashdex’s DEFI, registered no flows for the day.

A total of $2.26 billion was traded on Monday. The trading volume for these ETFs was less than in March when it exceeded $8 billion on some days. Meanwhile, these funds have collectively attracted $16.11 billion in net inflow since their January launch.

What’s Next For Bitcoin?

Earlier this month, bitcoin’s price decline was mainly due to fears of massive selling pressure from Mt. Gox and the German government’s BTC sales.

But the assassination attempt on pro-crypto former US President and presumptive Republican candidate Donald Trump at Saturday’s rally seemed to spark a recovery in the world’s largest digital asset, and experts are bullish on the asset’s price trajectory going forward. Bitcoin surged more than 9% over the past week and was currently trading slightly below $64,000.

Veteran trader Peter Brandt discussed bitcoin’s price outlook, suggesting a potential major rally. He referred to a pattern he terms “Hump->Slump->Bump->Dump->Pump” and highlighted that the July 5 double top attempt was a bear trap, confirmed by the July 13 close. He sees a likely continued upward trend but warned that a close below $56,000 would negate this bullish view.

“Bitcoin $BTC could be unfolding its often-repeated Hump…Slump…Bump…Dump…Pump chart construction. Jul 5 attempt at the double top was a bear trap, confirmed by Jul 13 close. Most likely scenario now is that bears are trapped. Close below $56k negates this interpretation”

Reports /Trainviral/

Continue Reading

Crypto

LI.FI DeFi Platform Exploited, Over $8M Lost

Published

on

By

PeckShield alert reveals LI.FI’s protocol vulnerability is similar to a March 2022 attack, with the same bug recurring.

The decentralized finance (DeFi) platform LI.FI protocol has suffered an exploit amounting to over $8 million.

Cyvers Alerts reported detecting suspicious transactions within the LI.FI cross-chain transaction aggregator.

LI.FI Issues Warning After $8 Million Exploit

LI.FI confirmed the breach in a statement on July 16 via X: “Please do not interact with any http://LI.FI powered applications for now! We’re investigating a potential exploit.” The team clarified that users who did not set infinite approval are not at risk, emphasizing that only those who manually set infinite approvals seem to be affected.

According to Cyvers Alerts, more than $8 million in user funds have been stolen, with the majority being stablecoins. According to on-chain data, the hacker’s wallet holds 1,715 Ether (ETH) valued at $5.8 million and USDC, USDT, and DAI stablecoins.

Cyvers Alerts advised users to revoke relevant authorizations immediately, noting that the attacker is actively converting USDC and USDT into ETH.

Crypto security firm Decurity provided insights into the exploit, stating that it involves the LI.FI bridge. “The root cause is a possibility of an arbitrary call with user-controlled data via depositToGasZipERC20() in GasZipFacet, which was deployed 5 days ago,” Decurity explained on X.

“In general, the risks behind routers, cross-chain swaps, etc. are about token approvals. Raw native assets like (unwrapped) ETH are safe from these kinds of hacks b/c they don’t have approvals as an option. Most users & wallets also no longer do “infinite approvals” which gives a smart contract total control on removing any amount of their tokens. It’s important to understand which tokens you’re approving to which contracts.

This dashboard looks for all transactions of a user that intersects Lifi. Not all of these transactions indicate risk- but you can see how, broadly, integrations & layers of tech (like how Metamask bridge uses Lifi on BSC) can complicate how users do or don’t put their assets at risk. Revoke Cash is the most well known approval manager app.

But it’s also good security practice to simply rotate your address. New addresses start with 0 approvals, so starting fresh by moving your tokens to a fresh address is another good security practice.” – commented Carlos Mercado, Data Scientist at Flipside Crypto.

Recent Exploit Mirrors March 2022 Attack

Further analysis by PeckShield alert revealed that the vulnerability is similar to a previous attack on LI.FI’s protocol that occurred on March 20, 2022. That incident saw a bad actor exploit LI.FI’s smart contract, specifically the swapping feature, before bridging.

The attacker manipulated the system to call token contracts directly within their contract’s context, making users who had given infinite approval vulnerable. This exploit resulted in the theft of approximately 205 ETH from 29 wallets, affecting tokens such as USDC, MATIC, RPL, GNO, USDT, MVI, AUDIO, AAVE, JRT, and DAI.

“The bug is basically the same. Are we learning anything from the past lesson(s)?” PeckShield Alert said in a July 16 X post.

Following the 2022 incident, LI.FI disabled all swap methods in its smart contract and worked on developing a fix to prevent future vulnerabilities. However, the recurrence of a similar exploit raises concerns about the platform’s security measures and whether adequate steps were taken to address the vulnerabilities identified in the previous breach.

LI.FI is a liquidity aggregation protocol that allows users to trade across various blockchains, venues, and bridges.

Reports /Trainviral/

Continue Reading

Trending

Copyright © 2024 TechDaja News.